


The Covid-19 cargo congestion brought on by extreme demand in combination with operational disruptions is very real and felt across supply chains globally. In the U.S. in particular, all parts of the supply chain are facing unprecedented pressures – there is a lack of rail and truck capacity, warehouses are full, and ports are bursting at the seams. It is in part in this context that the President is issuing an Executive Order that addresses shipping along with other industries.
The driver of these problems is demand for imports by U.S. consumers and U.S. businesses. Of the past 12 months, 11 months have had a year-on-year growth in spending on consumer goods of over 10%. To put this into perspective, in the 18 years before the pandemic, the average growth rate was 4.7%.[1] The impact of this sustained increase in spending on consumer goods is manifested in the volume of U.S. container imports stressing the supply chain. In its most recent assessment of market conditions, Drewry Shipping Consultants concludes: “The surge in Asian exports being shipped to North America continues unabated. In the first three months of 2021, eastbound volumes grew by 34% – the highest quarterly gain by far since Drewry’s current records began in 1995.”[2]
Ocean carriers literally have all hands-on deck – both on and off the ships
Ocean carriers are employing all available capacity and pulling out all stops to manage the operational disruptions brought on by Covid-19. But when marine terminals cannot clear the cargo already on the docks, ships cannot berth to discharge and load cargo. And marine terminals cannot clear cargo if the importers of that cargo have no warehouse or distribution space to put those containers. And containers are stuck in many places in the U.S. waiting for adequate rail and truck capacity to move them.
“This is not the fault of any given supply chain actor. Supply chains simply cannot efficiently handle this extreme demand surge, thus resulting in the delays, disruptions and capacity shortages felt across the chain. All supply chain players are working to clear the system, but the fact is that as long as the massive import demand from U.S. businesses and consumers continues, the challenges will remain,” says John Butler, President & CEO of World Shipping Council.
Liner shipping remains highly competitive, and lack of competition is not the cause of the cargo congestion
The industry remains competitive by any measure, and the current situation is not caused by any lack of competition. There are over 50 ocean carriers operating more than 1,000 ships that provide some 180 liner services to U.S. importers and exporters.[3] The U.S. Department of Justice and others look at the Herfindahl-Hirschman Index (HHI) as a measure of an industry’s market concentration.[4] The Herfindahl-Hirschman Index (HHI) is calculated by squaring the market share of each company competing in the market, and then summing the resulting numbers, ranging from close to zero to 10,000. The higher the number, the more concentrated the market. A market in which the HHI is below 1,500 is considered a competitive marketplace; between 1,500 and 2,500 is moderately concentrated; and markets in which the HHI is in excess of 2,500 points are considered to be highly concentrated.
The HHI calculation for the US international liner shipper market, using container operators’ current vessel capacity serving U.S. trades, is less than 1,000, thus making it a competitive industry.
The competitive nature of the industry is also readily visible when looking at the prices that shippers have paid over time to move their cargo. Rates vary by origin and destination combination and are negotiated and agreed to by individual carriers and their customers. The largest U.S. trade is that between the U.S. and Asia. The two figures below show the development of all-in rates as reported by Drewry between 2006 and May 2021 between major ports in Asia and LA.
Figure 1 shows that rates from Asia to the U.S. are volatile but have over time moved predominantly within the USD 2,000 to USD 3,000 per FEU band. The unprecedented surge in rates from Q2 2020 onwards is the clear result of the supply-demand imbalances as well as supply chain bottlenecks caused by Covid-19.
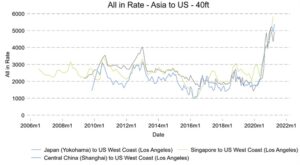
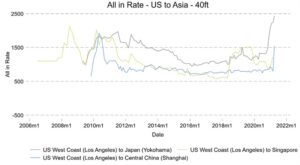
Figure 2 shows rates in the other direction, from Los Angeles to the same destination ports in Asia. These rates are much lower and well below USD 1,500 in recent years. The large difference between rates on imports from ports in Asia to the U.S. versus rates on exports from the U.S. to Asia is caused by the trade imbalance between the two regions. The volume of imports from Asia has historically been about twice as much as that of exports from the U.S. to Asia, and during certain periods over the last year has risen to 3 times as much. It also shows the asymmetric impact of the surge in demand: the import rates from Asia to the U.S. have increased faster and much more than the rates on exports from the US to Asia.
The graphs clearly show that price movements in this market are driven by supply and demand and are the result of a competitive market. Even though deployed vessel capacity on the transpacific is at an all-time high, with all available ships carrying cargo, the huge and sustained increase in U.S. imports has physically overwhelmed the available capacity and has resulted in a surge in pricing.
The rate development before the Covid-19 pandemic is also indicative of a competitive market, with nominal rates staying flat, which corresponds to decreasing rates in real terms corrected for inflation. The structure and level of concentration in the container shipping market has not changed during the pandemic. If anything, carrier actions show a well-functioning market with low barriers to entry: new services have been launched, new carriers have entered the market[5], and the amount of vessel orders in the first half of the year surpasses 2019 and 2020 combined, reaching the highest level in 20 years according to VesselsValue[6].


